
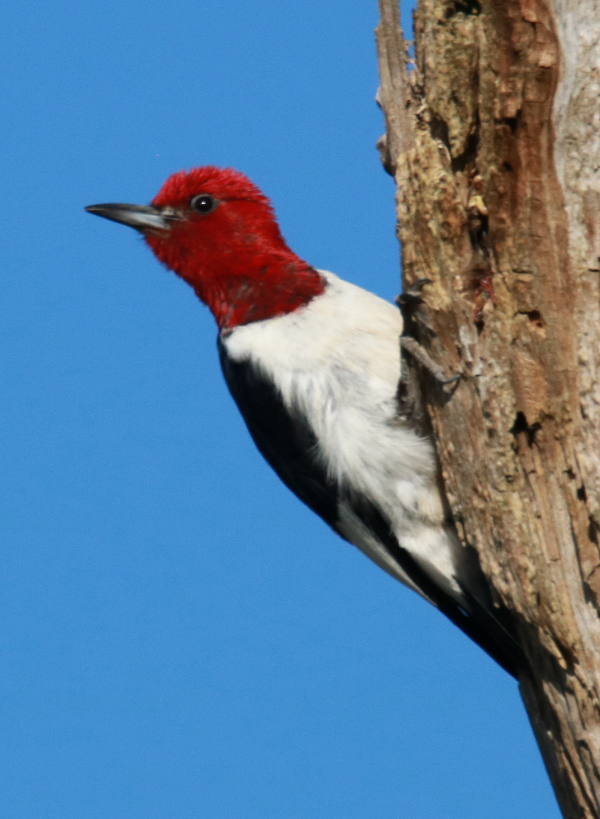
Red-headed Woodpeckers are one of the focus species of the Northeast Bird Habitat Conservation Initiative (photo by Paul Konrad).
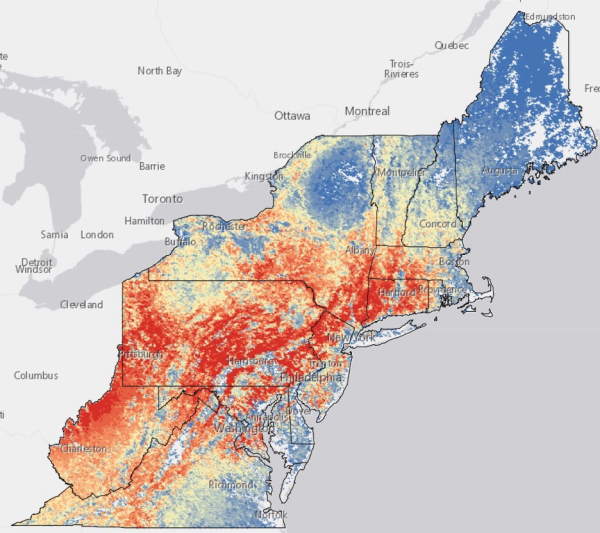
This map shows Wood Thrush abundance in northeastern states. Cool colors (blues) indicate lower abundance and warm colors show greater abundance (red) of Wood Thrushes during the nesting season (map courtesy of the Northeast Bird Habitat Conservation Initiative).
|
Maintaining the habitats that birds and other animals need on private or unprotected lands can be complicated, but now there’s a free mapping tool to help all interested individuals and groups work cooperatively and share knowledge across 14 northeastern states. This mapping tool is founded upon the Cornell Lab’s eBird Status & Trends nesting season data for 43 bird species in 5 habitat types: grassland, forest, shrub/scrub and young forest, wetland/marsh, and coastal/shoreline. The focus species were selected based on their high priority status or climate vulnerability; species such as Wood Thrushes, Eastern Towhees, and Red-headed Woodpeckers. eBird is among the world’s largest biodiversity-related science projects, with more than 100 million bird sightings contributed annually by eBirders located around the world.
The tool was developed by the Northeast Bird Habitat Conservation Initiative, which is itself a collaboration among The Regional Conservation Partnership Network, Audubon groups, Highstead, and the Cornell Lab of Ornithology. “The interactive mapping tool will help support the work of regional partnerships, land trusts, and land managers, as well as benefit northeastern bird species in need of conservation attention,” said Sara Barker, leader of the Cornell Land Trust Bird Conservation Initiative. “It will support activities such as habitat management planning and stewardship development, land prioritization and acquisition strategies, and landowner and community engagement, all through the lens of bird conservation.”
The tool pulls together relevant databases and presents them as layers on the maps, a fairly common GIS technique (GIS = geographic information systems). In this case, the maps include strategic land conservation and climate data layers, such as protected open space, Audubon’s Important Bird Areas, and The Nature Conservancy’s Resilient and Connected Landscapes data. These layers can then be overlaid with eBird modeled data to help spotlight where land planning and bird habitat conservation efforts are needed most. GIS experts at Harvard Forest and Highstead worked closely with Cornell Lab scientists to integrate the data and maps to create this interesting interactive tool.
“Using data visualization tools such as this mapping product enables us to add birds to the equation when determining the highest value habitats to protect,” said Barker. “It can help conservationists set priorities and make the best use of limited conservation dollars.”
For more information, you can refer to Northeast Bird Habitat Conservation Initiative and eBird Status & Trends