
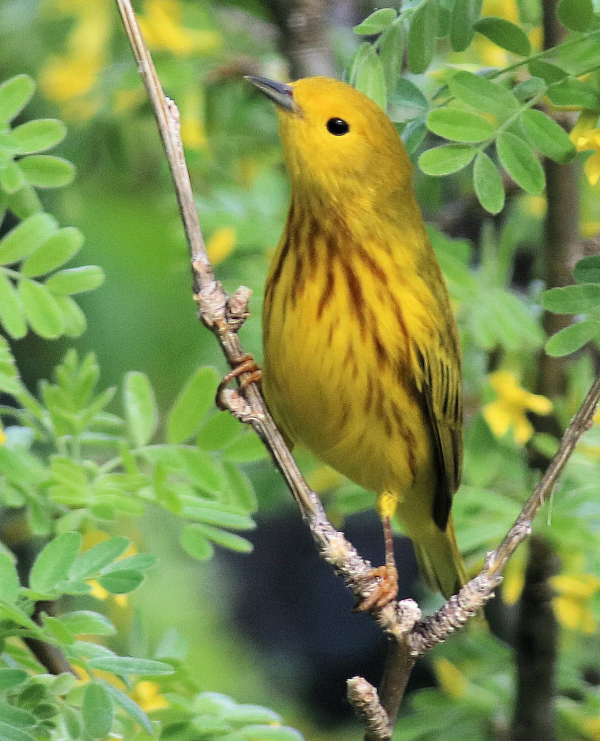
You can monitor the timing of many birds, such as Yellow Warblers, during their spring migration, and throughout the year, using the eBird Abundance Animation maps
|
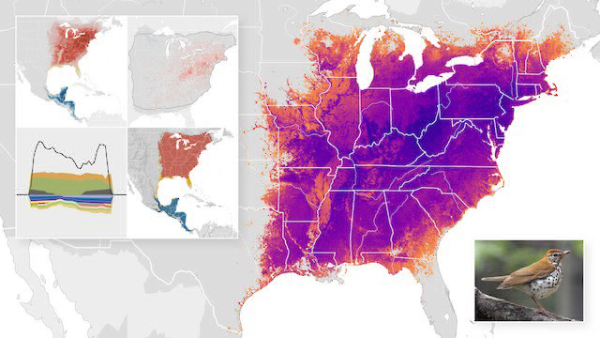
One of the most impressive new eBird features is the ability to track representative species through the year, from their wintering range to their nesting range and back – week by week. Today, this fantastic program that features the “Abundance Animation” maps will permit you to track the spring migration of species as they migrate northward and monitor their progress to your neighborhood and beyond. It’s a great way to check when a favorite species should arrive in your area, or in an area you plan to visit. It’s so much fun to see how and when species migrate via these maps, say Canada Warblers and Lazuli Buntings, or Mountain Bluebirds and Purple Martins, to name a few.
Of course, using the eBird Abundance Animation maps you can track the collective moments of a species throughout the entire year, so when spring migration is complete, you can view a species’ nesting range – week to week – then trace their fall migration south again in real time. It’s also very interesting to see where a given species winters; you may be very surprised.
Actually, when you click the arrow button in the center of the Abundance Animation map, you animate the annual movement of the species you choose. The range of the entire species will flow in a continuous tracking process from January through December. But the best aspect of the interactive maps is that if you click anywhere on a map the action will stop, then you can use the arrow buttons at the bottom right side of the map to forward the migration process week by week, which is absolutely revealing if you’re interested in determining when to expect Common Yellowthroats and Least Flycatchers in your neighborhood.
To see what I’m sharing with you first hand, go to the following eBird webpage for Yellow Warblers, and click on the arrow in the center of the Abundance Animation map; then try the “week by week” arrows at the bottom right corner of the map, at https://ebird.org/science/status-and-trends/yelwar/abundance-map-weekly
It’s really interesting to do some free-wheelin’ on this particular “Status and Trends” segment of the “Science” section of eBird. Talk about a great opportunity to enjoy some interesting and insightful information at your own pace using your own interests to guide you. If nothing else, work your way through the list of birds that are featured with these remarkable Abundance Animation maps (see https://ebird.org/science/status-and-trends).
I’m going to keep this Birding Lifestyles article short, and let the eBird maps inform and entertain you with a wealth of data and geographic info. I’m sure you will enjoy it and benefit from time you spend investigating these maps and other information provided in many ways.
One more note: Some of the species you may refer to might spend the winter months in locations in South America, beyond the southern limit of the North American map that eBird uses for this series. In those cases, if you are interested in seeing the winter range, you can refer tohttps://ebird.org/map/yelwar1? – just type the species name in the appropriate box at the top of the page. And to access all options eBird has to offer, start at the beginning, at https://ebird.org/
Article and photographs by Paul Konrad
Share your birding experiences at editors2tbw@gmail.com